See what the session actually sent
Capture every request as a standard HAR — desktop browsers and real Android devices, HTTPS decrypted, with nothing to install in your app and nothing to set up on your laptop. Then attach it to the bug.
Desktop browsers and Android · not available on iOS sessions
The “frontend bug” is usually a request that failed
A wrong price, an empty list, a save that quietly fails — the cause is often a call that returned 403, never fired, or fired twice. Capture every request the session made, and the file shows whose bug it is.
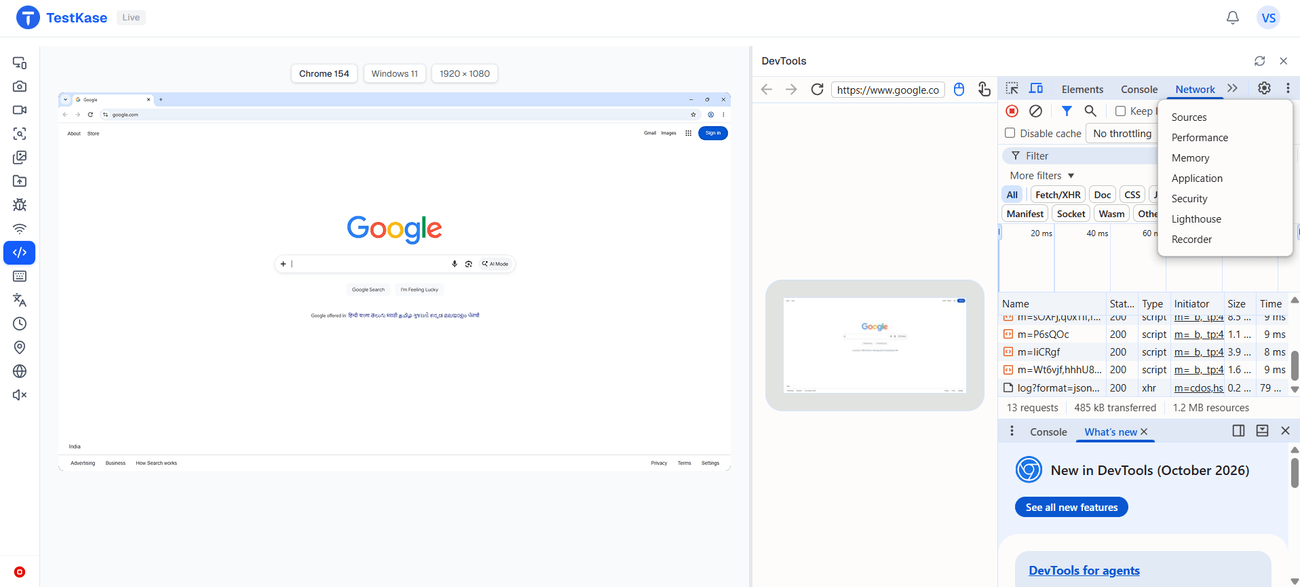
What the capture gives you
Every request, not a sample
The full sequence in order, with status codes and timings — including calls that failed before anything showed on screen.
Headers and payloads
What was sent and what came back — a missing token, a stale cache header, a payload shaped differently for this user.
Real devices, not your laptop
On Android, we capture at the device itself — what the app really sent, not what you could copy on your own machine.
HTTPS decrypted
Encrypted traffic captured in readable form, not a list of connections you can't open.
A standard file anyone can open
A plain HAR any engineer opens in their own DevTools — no account with us required.
Attach it to the bug
File the bug from the same session, so the report carries the cause, not the symptom.
Captured on every browser and real Android
A full HAR from the browser and an installed app, HTTPS decrypted, on macOS, Windows and real Android — including Safari, which shows you nothing on its own.
 Chrome
 Edge
 Firefox
 Safari
 Android
Want the live panel instead of a file? Browser DevTools attaches a network tab to Chrome and Edge sessions.
Frequently asked questions
On real Android phones and tablets, yes — the session captures traffic from both the browser and an installed app, decrypted, as a standard HAR file. On iOS, a hands-on Live session has no network capture; we offer that in our automated testing, not in a Live session.
No. Nothing is added to your app and nothing is set up on your machine. The capture happens around the session, which is also why it catches requests your app made before any tool you set up yourself would have started watching.
Yes, except where a domain uses certificate pinning. Pinning is built to stop anyone from reading the traffic, so pinned calls show up as connections you cannot read — the same limit every tool in this market has. Everything unpinned in the same session captures normally.
A HAR — the standard format every browser's developer tools can import. Hand it to a backend engineer and they open it in their own browser without needing an account with us.
Yes for the network log. This matters because Safari gives up nothing on its own: its automation shows no console and no network data, so a session HAR is the only way to see what a Safari session sent. There is still no console output on Safari.
The DevTools panel is interactive and live, attached to Chrome and Edge sessions while you work. The network log is a file covering the whole session, which you can attach to a bug and send to someone who was not there. Most people use the panel to investigate and the file to hand over.
No — it is a record of what happened, not a proxy that pauses or rewrites requests as they go. Like other session files, logs are deleted automatically after thirty days, so download anything you want to keep.
Yes. The capture records every request in order, including calls that returned an error or fired before anything showed on screen, so a wrong price or an empty list traces back to the request behind it — the full sequence, not a sample.
Stop guessing which side the bug is on
Capture the session's traffic, read the failing request, and send the file to whoever owns it.