37 reports, and 11 that tell you something new
See where a release stands at a glance — passed, failed and blocked, cycle progress and coverage — then a set of reports that read your own history for flaky tests, stale cases and release risk.
Included on every plan, free included · no AI credits consumed
- Passed
- 68%
- Failed
- 14%
- Blocked
- 8%
- Not run
- 10%
The ship decision gets made on who sounds confident
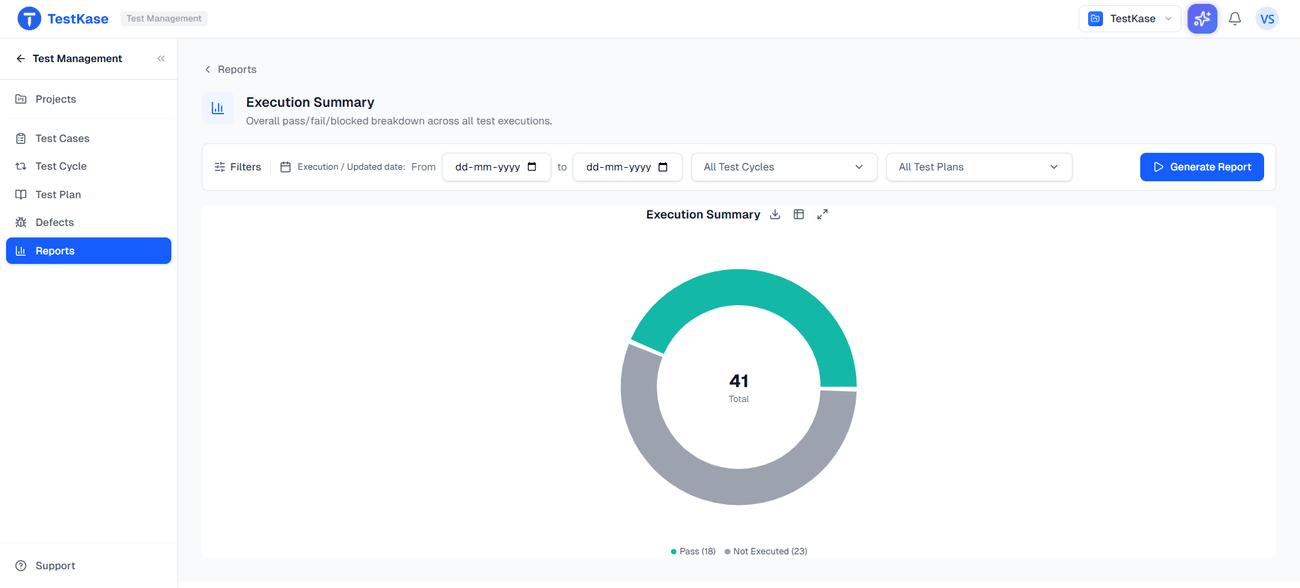
The data that answers “can we ship” is already in the tool. It just is not in the room. Put the cycle on one panel — passed, failed, blocked, how far the run has got, what is covered — and the meeting starts from evidence.
Open the report, not a channel
The everyday views a QA lead reads during a cycle, not at the end of one.
Execution
What ran, passed, failed and is still waiting — per cycle, folder and person.
Coverage
What is tested and what is not, traced back to requirements.
Defects
What testing found and where it went — including issues filed to Jira, GitHub or GitLab.
Trends
The same figures over time, so a falling pass rate is visible, not just felt.
11 reports that tell you something new
These read your own execution history and surface what no single view shows — the flaky test, the folder nobody covers, the suite that got slow. They are the reports people come back for.
Flaky Tests
Tests that change result without the code changing — found by pattern, not memory.
Release Readiness
One score across your history, so go/no-go starts from evidence.
Risk Heatmap (Folder)
Which folders carry the most risk — usually the under-tested ones.
Risk Heatmap (Feature)
The same risk map by feature — the one product owners read.
Test Case Quality
Finds cases with no steps, no expected result, nothing to act on.
Predictive Failure
Which tests are most likely to fail next — order a short run by it.
Tester Effectiveness
Per-person scorecards for spotting an imbalance across the team.
Stale Tests
Cases nobody has touched or run in a long time.
Cycle Health
A cycle in flight, so you catch it going wrong in time to act.
Suite Optimization
Redundant tests that cost run time without adding coverage.
Execution Velocity
Throughput over time — see when testing slowed down.
All 37, on every plan
Reporting is not an upgrade here and is not priced per report — free plan included.
The insights cost nothing to run
They read your history with queries, not a model — no AI credits, the same answer every time. Our real AI lives on the AI page.
Frequently asked questions
37 reports, on every plan including free. Reporting is not an upgrade here and is not priced per report, which is worth checking against alternatives — in several competing products the analytics that make the tool worth having sit behind a higher tier.
No, and we used to say they were until we corrected it. They contain no model call — they are queries and heuristics over your own execution history. That means they consume no AI credits, they work the same on a free plan, and they are deterministic: the same data gives the same answer every time, which is what you want from something informing a release decision.
Mostly patterns across time that no single view shows: which tests change result without the code changing, which cases nobody has touched in months, which parts of the suite are redundant, and whether your testing throughput is falling. Any one of those is visible if you go looking; the point is that nobody does.
Execution and coverage reporting works from your first cycle. The derived ones need history — flakiness, velocity and predictive failure are statements about patterns, so they say little in week one and get sharper as executions accumulate.
Yes, where those results are reported into the product — through the CI integrations, the webhook, or the automation reporters. A report describes what was recorded, which is also the usual reason a coverage figure looks lower than a team expects: testing done outside the tool is invisible to it.
Both, deliberately split. Execution and coverage reporting is for the people doing the work and answers 'where are we'. Release Readiness and the risk heatmaps answer the question asked about the work — can we ship, and what is risky — which is what usually gets decided in a meeting on the strength of how confident someone sounds.
Read the guide: Test reports stakeholders actually want →No — treat it as a conversation starter. It measures recorded activity, not judgement or difficulty, so it is useful for spotting an imbalance across a team and wrong as an appraisal input.
No. There is no custom report builder, so you get the reports that exist rather than a designer for creating your own. If your organisation mandates a particular reporting format, TestRail's configurability is a genuine advantage and worth weighing.
Find out what your execution history already knows
Flaky tests, stale cases and release risk are in the data you have been collecting. These reports read it.